 EMODnet Product Catalogue
National Institute of Water and Atmospheric Research
Type of resources
Available actions
Topics
Keywords
Contact for the resource
Provided by
Years
Formats
Representation types
-
Here we provide data from the Ross Ice Shelf ocean cavity. Location - The HWD2 Camp was established in October of 2017 at 80o 39.497’S, 174o 27.678’E where the ice is moving seaward at around ~600 m a-1 and is sourced from the Transantarctic Mountains. Profiling Instruments - Profiling was primarily conducted with an RBR Concerto CTD (conductivity-temperature depth) profiling instrument, and this was cross-calibrated against irregular profiles with an RBR Duet (pressure and temperature only), a SBE37 MicroCat CTD as well as moored SBE37 MicroCat CTDs. The RBR unit is small and has suitable sensor capability (temperature and conductivity accuracies of ±0.002°C and ±0.003 mS cm-1). Its conductivity cell design is not prone to fouling by ice crystals, making it ideal for work in the sometimes crystal-laden borehole conditions. We were inconsistent in how we mounted the CTD on its protective frame and this appeared to make small difference in the conductivity signal (resulting in an ~0.03 psu variation). This was post-corrected based on the essentially invariant mooring data from the lower water column as well as SBE37 cross-calibration profile data. Because of the potential for sediment contamination of the sensors, the profiles were mostly conservative in their proximity to the sea floor. On several occasions, profiles were conducted all the way to the sea floor. The temperature and salinity are presented in EOS-80 in order to compare with available data. Eighty three profiles are provided here (ctd_HWD2_*.dat). In addition, limited microstructure profiling was conducted to provide insight into some of the mixing details. The profiles were conducted by lowering the instrument to the ice base then commencing a sequence of three up-down “yo-yos” before returning to the surface and downloading. A data segment is included here (VMP_HWD2.dat). There were some challenges registering the vertical coordinate for the profiles. The melting of the borehole generates a trapped pool of relatively fresh water. The interface between this and the ocean should be near the base of the hole or a little higher – with seawater intrusion. However, there were some instances where the interface was at a higher pressure (i.e. apparently in the open water column). The best explanation for this is that the water in the borehole is not at static equilibrium for some period after initial melting. We use 34.3 psu as a cut-off, in addition to a pressure criterion to identify the top of the useful oceanic profile. It is also not inconceivable that water was being ejected from the hole, but it is unlikely that this would have impacted in the consistent observed pattern. Instrumented Mooring - The mooring instruments at HWD2-A comprised 5 Nortek Aquadopp single point current meters in titanium housings reporting to the surface (30-minute interval, Table SI-Three) via an inductive modem to a Sound-9 data logger and Iridium transmitter. The current meter measurements were corrected to account for the 138o magnetic declination offset (i.e. the south magnetic pole is to the north-west of the field site). Five files are provided here (HWD2_Init_rcm*.dat4). Details in: Stevens C, Hulbe C, Brewer M, Stewart C, Robinson N, Ohneiser C and Jendersie J, 2020. Ocean mixing and heat transport processes observed under the Ross Ice Shelf controls its basal melting, accepted PNAS, May 2020. Important Note: This submission has been initially submitted to SEA scieNtific Open data Edition (SEANOE) publication service and received the recorded DOI. The metadata elements have been further processed (refined) in EMODnet Ingestion Service in order to conform with the Data Submission Service specifications.
-
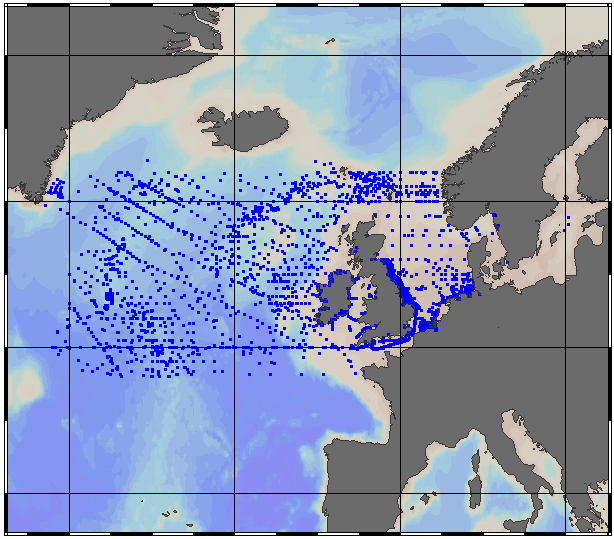
EMODnet Chemistry aims to provide access to marine chemistry data sets and derived data products concerning eutrophication, ocean acidification and contaminants. The chemicals chosen reflect importance to the Marine Strategy Framework Directive (MSFD). This regional aggregated dataset contains all unrestricted EMODnet Chemistry data on contaminants, and covers the North Sea with 34978 CDI records divided per matrices: 1460 biota, 24740 water profiles, 6090 sediment profiles and 261 sediment time series. For water, the temporal range is from 1959-10-03 to 2019-12-30. For sediment, the temporal range is from 1970-07-11 to 2019-12-18 for profile data and from 1993-09-16 to 2015-06-15 for the time series. For biota, the temporal range is from 1979-02-26 to 2018-02-28. Data were aggregated and quality controlled by 'Aarhus University, Department of Bioscience, Marine Ecology Roskilde from Denmark'. Regional datasets concerning contaminants are automatically harvested. Parameter names in these datasets are based on P01, BODC Parameter Usage Vocabulary, which is available at: https://vocab.seadatanet.org/p01-facet-search. Each measurement value has a quality flag indicator. The resulting data collections for each Sea Basin are harmonised, and the collections are quality controlled by EMODnet Chemistry Regional Leaders using ODV Software and following a common methodology for all Sea Regions. Harmonisation means that: (1) unit conversion is carried out to express contaminant concentrations with a limited set of measurement units (according to EU directives 2013/39/UE; Comm. Dec. EU 2017/848) and (2) merging of variables described by different “local names” ,but corresponding exactly to the same concepts in BODC P01 vocabulary. Detailed documentation is available at: https://doi.org/10.6092/8b52e8d7-dc92-4305-9337-7634a5cae3f4 Explore and extract data at: https://emodnet-chemistry.webodv.awi.de/contaminants%3ENorthSea The harmonised dataset can also be downloaded as ODV spreadsheet (TXT file), which is composed of metadata header followed by tab separated values. This worksheet can be imported to ODV Software for visualisation (More information can be found at: https://www.seadatanet.org/Software/ODV ). The same dataset is offered also as XLSX file in a long/vertical format, in which each P01 measurement is a record line. Additionally, there are a series of columns that split P01 terms in subcomponents (measure, substance, CAS number, matrix...).This transposed format is more adapted to worksheet applications users (e.g. LibreOffice Calc). The original datasets can be searched and downloaded from EMODnet Chemistry Chemistry CDI Data and Discovery Access Service: https://emodnet-chemistry.maris.nl/search